Get Dashboard Creation Services from Our Experts
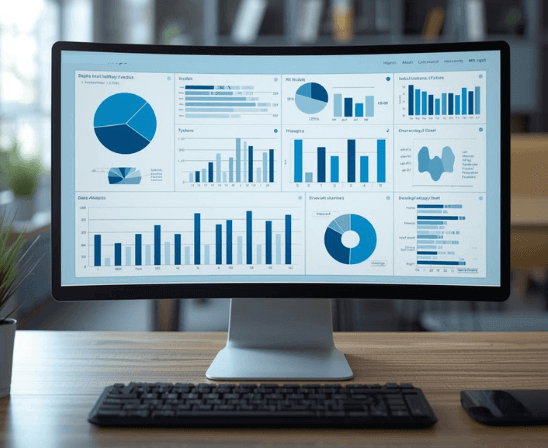
Dashboards are visual interfaces that are used in applications, websites, and software to offer a consolidated view of data such as key metrics, user activities, or business analytics. A well-designed dashboard enables users to monitor progress, track performance, and make decisions without working with raw data. Are you looking for professional dashboard creation services? At Transdimensionresearch.com, we specialize in creating custom dashboards that transform raw data into actionable insights that enable strategic decision-making.
We create dashboards that integrate data visualization capabilities, interactive functionalities, and intuitive user interfaces, thus maximizing the potential of clients’ data. In this article, we have discussed the dashboard creation process followed by our experts. We have also highlighted some of the dashboard creation tools we employ, including Power BI, Tableau, Google Sheets, and Microsoft Excel.
What is Dashboard Creation?
Dashboard creation is the process of developing visual interfaces that provide a consolidated view of metrics, data points, and Key Performance Indicators (KPIs) clearly and concisely. Dashboards offer a dynamic framework to explore, understand, and communicate insights derived from diverse datasets across various domains such as finance, healthcare, and business. Because dashboard development requires strong data analytics skills, visualization, and database management, most individuals and organizations prefer to hire an expert to create a dashboard instead of relying on generic solutions.
Dashboard Creation Process: A Detailed Guide by Our Experts
Our professionals follow a structured procedure when developing dashboards for clients. By following a systematic method when creating dashboards, we ensure that the final product is not just visually appealing, but also accurate and relevant for use. Below is the step-by-step process followed by our experts to create dashboards:
Step 1: Define Objectives
Defining objectives is the foundational step for establishing the purpose of the dashboard and guiding decisions on the data, metrics, and visualizations required to acquire useful insights. Our experts identify the main goals of creating dashboards by gathering input from relevant stakeholders to ensure that the dashboard caters to the specific requirements of its users. We also identify the key metrics and KPIs that will measure the progress towards the defined objectives.
Step 2: User Needs Analysis
Conducting a user needs analysis is essential for ensuring requirements are effectively met. Our professionals begin by identifying the primary users of the dashboard, for example, executives, managers, analysts, or IT specialists. We then gather information directly from potential users through methods such as interviews, focus groups, or surveys to understand their respective needs and preferences. To ensure that the dashboard effectively serves its target audience, we create illustrative personas that represent the needs and preferences of different user groups. User personas provide a picture of behavior, goals, and pain points, guiding dashboard design and feature prioritization.
Step 3: Data Collection and Preparation
Data collection and preparation guarantee that the data is built on a foundation of accurate data, producing useful insights. Our experts employ both primary and secondary techniques of data collection based on client needs. We prepare data by addressing common problems such as inconsistent formats, duplicates, missing values, and incorrect entries. Other services offered by our experts include AI agent development, AI model training, AI workflow automation, qualitative and quantitative data analysis, among others.
Step 4: Design the Dashboard
Data scientists design the dashboard to ensure that the final interface is functional, informative, visually appealing, and easy to utilize for users. Key factors we consider include the wireframes and mockups, intuitive user interface design, technical requirements, storyboarding, and project management. In terms of layout, we utilize clear and descriptive titles and headings, a reasonable amount of white space, and proper information hierarchy from the most important details to the least. Our service providers develop an excellent and user-friendly dashboard that eliminates cognitive overload and enables users to understand the metrics presented quickly.
Step 5: Select Dashboard Creation Tool
Selecting the right creation tools and software directly influences the success of the dashboard. Dashboard creation tools we use include Python, Power BI, Tableau, Google Sheets, Microsoft Excel, and Notion. Our experts select the most suitable dashboard creation tool for our clients based on features and compatibility with existing systems.
Step 6: Develop and Implement the Dashboard
With the data, design, and tools established, the next step involves developing and implementing the dashboard. We begin by setting up prepared data and linking the dashboard software to data sources. After establishing the data connections, we develop the dashboard according to wireframes and mockups and include the visuals that will display the data.
Step 7: Test and Validate
Conducting quality assurance testing and validation helps ensure that the final dashboard is useful and effective. For user tests, our experts choose a group of individuals and give them tasks to conduct on the dashboard, including information retrieval, visual interpretation, and performing actions. Performance testing involves evaluating the dashboard’s load times, responsiveness, and stability with various user loads.
Step 8: Deploy and Maintain
Deployment and maintenance involve making the dashboard available to primary users and ensuring its prolonged success and functionality. In dashboard deployment, our experts offer training to help users understand how to navigate and utilize the dashboard. We also offer comprehensive documentation where we illustrate all the dashboard’s functionalities, features, and measures for troubleshooting. Our experts also offer clear communication to relevant stakeholders on the benefits and estimated impact of the dashboard. When clients hire an expert to create a dashboard, they get access to a dedicated team of experts, available around the clock, who assist with inquiries.
Dashboard Creation Software Utilized by Our Experts
The choice of dashboard development software depends on client objectives, data source compatibility, budget, and functional requirements. Our experts select the most suitable dashboard creation software based on client objectives. Common software tools we employ when creating dashboards include:
1. Power BI Dashboard Creation
Power BI is a Microsoft-powered business intelligence tool that enables users to create interactive dashboards and reports to reveal patterns and insights hidden in large datasets. At Transdimensionresearch.com , we provide help with Power BI dashboard creation, customized to the client’s specific business objectives, enabling improved decision-making, performance monitoring, and strategic decisions. Our Power BI dashboard creation services encompass data source evaluation, formulating a KPI roadmap, custom development, and training and support. With our services, clients are assured of clear and interactive dashboards that follow industry best practices for governance, security, and compliance.
2. Tableau Dashboard Creation
Tableau is a business intelligence and data visualization tool that enables individuals and organizations to transform raw data into interactive dashboards, offering useful insights that can be utilized for informed decision-making. Our professionals offer the best Tableau dashboard creation services tailored to unique client needs, enabling seamless data visualization, analysis, and decision-making. By getting help with Tableau dashboard creation from our experts, clients can improve their understanding of complex data.
3. Dashboards with Google Sheets and Data Studio
Google Sheets is a cloud-based spreadsheet solution with collaboration and advanced tools that are used to visualize, process, and communicate data. Key steps followed by our experts when creating dashboards with Google Sheets include cleaning data, inserting charts, customizing charts in a “Dashboard” sheet, and adding features such as filters and conditional formatting. Hiring our Google Sheets dashboard creator allows clients to transform their complex data into easily understandable visuals, enabling real-time monitoring of KPIs and enhanced collaboration through cloud access. Data Studio is a web-based data visualization software that enables users to build customized dashboards and reports. At our company, we help individuals and organizations to utilize Google Data Studio’s advanced features to automate reporting and build dashboards that demonstrate useful insights.
4. Dashboards with Microsoft Excel and Power BI Publisher
Microsoft Excel is a spreadsheet program that is utilized to create analytical and interactive dashboards. The process we follow when creating dashboards in Microsoft Excel involves organizing data, using pivot tables and charts, and adding interactive elements such as slicers to visualize key metrics. With our professional Microsoft Excel dashboard creation services, clients get intuitive and visually appealing dashboards tailored to their needs.
5. Dashboards with Notion and Coda
Notion and Coda are software tools that allow users to organize data and create dashboards within a single, customizable environment. Our dashboard creation experts utilize Notion and Coda to create dashboards that combine databases, tables, and views into a clear layout customized to the client’s daily operations. We carefully map how information is added, updated, and shared, ensuring the dashboard remains accurate, easy to navigate, and consistent as clients’ data grows. In addition to dashboard creation, we also offer services such as market research, data analytics, and qualitative and quantitative data analysis. Reach out for any inquiries today for the best dashboard creation services.
Best Practices for Effective Dashboard Creation
Creating an effective dashboard requires careful planning, a clear understanding of user needs, and the selection of relevant data. Below are the best practices applied by our experts when developing dashboards:
- Consider the audience that will interact with the dashboard.
- Select the most suitable type of dashboard that aligns with the intended audience.
- Select KPIs that drive action.
- Apply a strategic selection of charts.
- Utilize an effective visual hierarchy and layout.
- Build collaboration into design.
Transform Data into Visual Insights with the Best Dashboard Creation Services
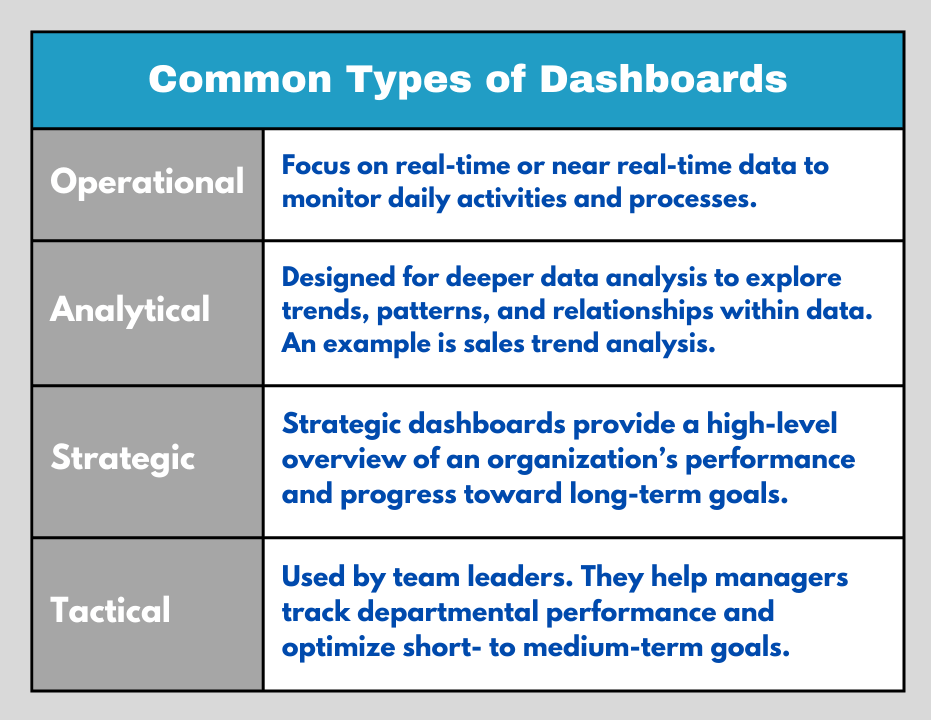
As the best data visualization company, our dashboard designs are custom-made to fit client requirements, ensuring that users can interpret information in an easily understandable manner. Our highly skilled data scientists develop excellent interfaces that prioritize user experience and deliver seamless dashboard User Interface/ User Experience (UI/UX) designs personalized to clients’ needs. There are several types of dashboards, each designed to fulfill specific objectives that our experts create, including i). analytical, ii). operational, iii). tactical, iv). strategic, and v) executive. When clients hire our professionals, they are assured of an exceptional dashboard that is visually appealing and scalable. The dashboard development services clients can get from our experts include, but are not limited to:
- Dashboard strategy and consulting.
- Customized dashboard creation.
- Dashboard integration with existing systems.
- Dashboard performance optimization.
- Dashboard maintenance and training.
- Existing dashboard modification.
- Dashboard data management.
Whether clients need custom KPIs, real-time updates, or flawless integrations, our team is readily available to help.
Why Hire an Expert to Create a Dashboard from Our Firm?
Our experts offer the best services designed to provide a holistic approach for clients looking to create visual tools that consolidate complex data into easily understandable dashboards. From strategic consulting to maintenance and support, we offer customized solutions based on client objectives. Reasons why clients choose us for help with dashboard creation include:
- Team of experts. We have a team of highly skilled data visualization experts who specialize in dashboard design and creation, and deliver excellent results customized specifically to client’s needs.
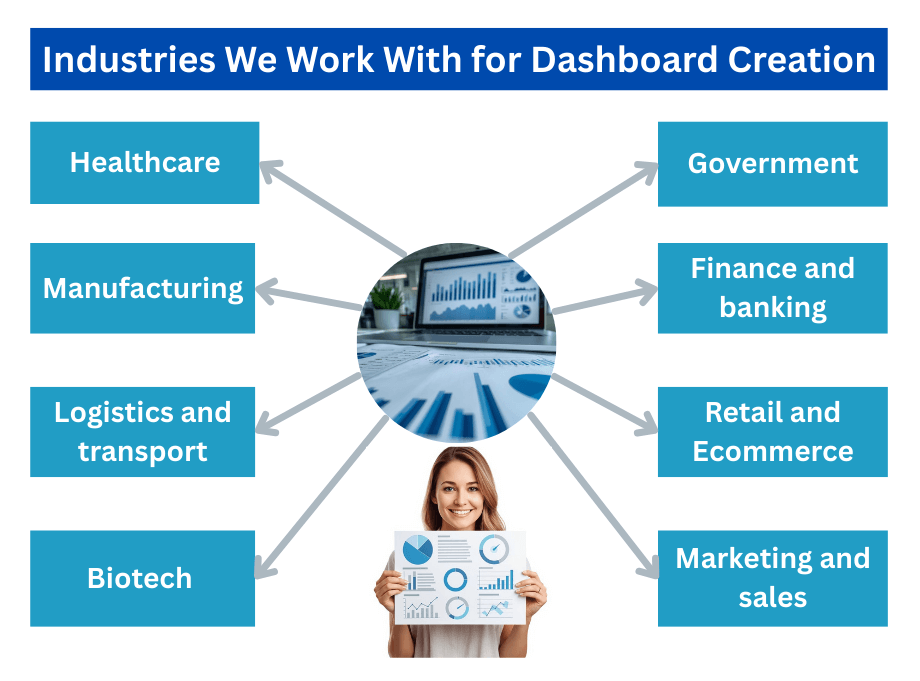
- Industry-focused expertise. Our experts provide the best dashboard creation solutions to clients in various domains, including healthcare, retail, business, human resources, IT, system monitoring, and market research, among others.
- Client-centric approach. Our experts focus on understanding clients’ unique needs and objectives and design custom dashboards that align with their goals.
- Excellent customer support. Our professional consultants offer comprehensive customer support by maintaining clear communication throughout the dashboard creation process and responding quickly to client inquiries or feedback. We also maintain easily accessible communication channels to ensure clients can reach out to us easily.
- Excellent data security. We prioritize data security by protecting clients’ information from unauthorized access, corruption, or theft throughout the dashboard creation process.
- Round-the-clock availability. We are available 24/7 to ensure clients can contact us whenever they need assistance, support, or feedback, regardless of their time zones. With our reliable dashboard creation services, clients get timely updates and quick problem resolution.
Table of Contents
Summary
A dashboard allows users to monitor patterns and make decisions based on the displayed information by offering a concise visual representation of key metrics and data points in a single view. To design and build an effective dashboard, creators should have strong analytical skills, expertise in data visualization, and an understanding of database management. Looking to hire an expert to create a dashboard? Our team delivers customized dashboards that are easy to understand. Contact us now to learn more.